Voting behaviour in Dutch Parliament
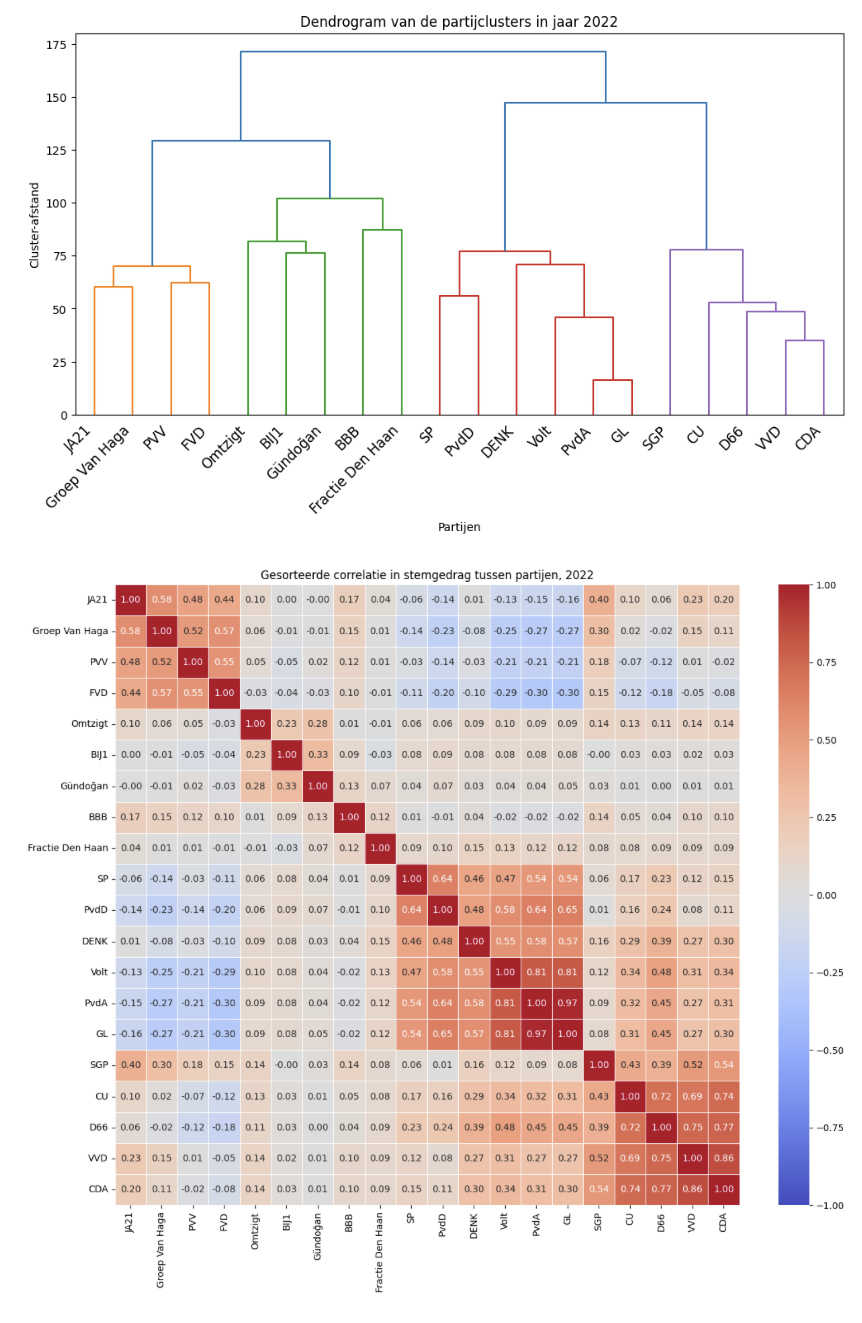
In the age of information, providing voters with accessible and comprehensive statistics is crucial for fostering an informed electorate. I made a visualisation website that explores the behaviour of all fractions of the Dutch Parliament – specifically, how they correlate over the years. This visualisation is available as Python code, or simply the interactive website! It aims to show what parties do, not what they say.

The app is built using:
- Flask
- Numpy
- Scikit
- Scipy
- Pandas
- sqlite3
- git-lfs
- heroku
- plotly.js
- Jupyter
Note that of course this wouldn’t be possible without the permissive dataset (CC BY 4.0) from Louwerse et al.!